
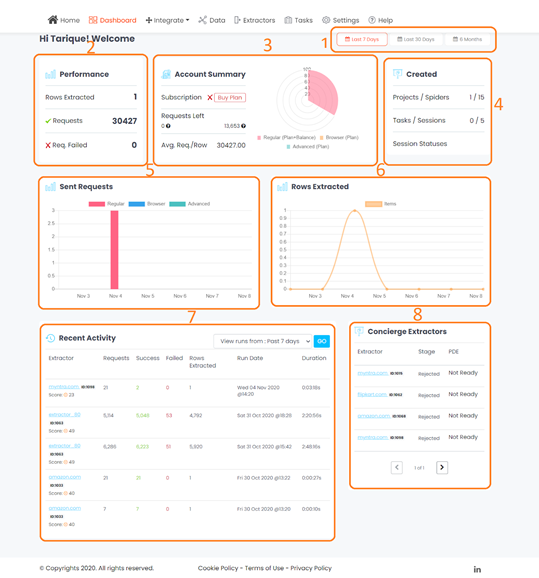
When user goes to the Web Automation Dashboard. User can see the following analytics report on the Dashboard page.
User should have provision to view the report by selecting the no. of days option
Last 7 Days
Last 30 Days
6 Months
User can see the performance like how many rows got extractracted, how many requests were successful, how many requests were failed.
User can see the Account Summary and can buy a plan.
User can see how many Projects and Tasks are created.
User can see how many requests were sent.
User can see how many rows are extracted.
User can see the recent activity of their own account. User should have the ability to select the different options like last 7days, 15 days, 30 days, 60 days and 100 days.
User can also see the list of extractor which they extracted till today.
You should login to leave comments.